Understanding Color Infrared Imagery for Forest Management
If you’ve been exploring the imagery tools in SilviCultural, you’ve probably noticed something striking: your forest doesn’t look like a forest. Instead of the familiar greens and browns, healthy trees appear in vibrant shades of red and pink, while stressed vegetation shows up as pale or even cyan. This isn’t a glitch in the software—it’s Color Infrared (CIR) imagery, and it’s one of the most powerful tools available for understanding what’s really happening in your woodlot.
The Secret Life of Leaves
To understand why vegetation looks so different in CIR imagery, we need to talk about what happens inside a leaf. When sunlight hits a tree, the leaf doesn’t just absorb all that energy—it’s actually quite selective about what it takes in and what it bounces back.
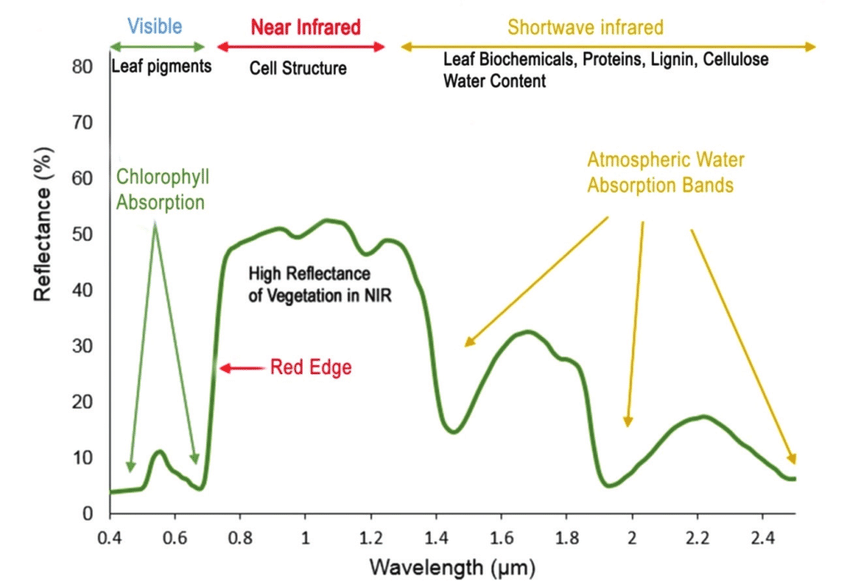
In the visible light spectrum (the colors we can see), healthy leaves appear green because they’re absorbing most of the red and blue wavelengths for photosynthesis while reflecting the green wavelengths back to our eyes. Chlorophyll, the pigment responsible for photosynthesis, is incredibly efficient at capturing visible light energy.
But here’s where it gets interesting: leaves reflect near-infrared light at dramatically higher rates—often 40-50% compared to just 5-10% of visible light. Why? Because near-infrared radiation carries heat but not the specific wavelengths that chlorophyll needs for photosynthesis. If a leaf absorbed all that infrared energy, it would overheat and literally cook itself. Instead, the leaf’s internal structure, particularly the spongy mesophyll layer, acts like millions of tiny mirrors, bouncing infrared light back out to keep the leaf cool.
What CIR Imagery Shows You
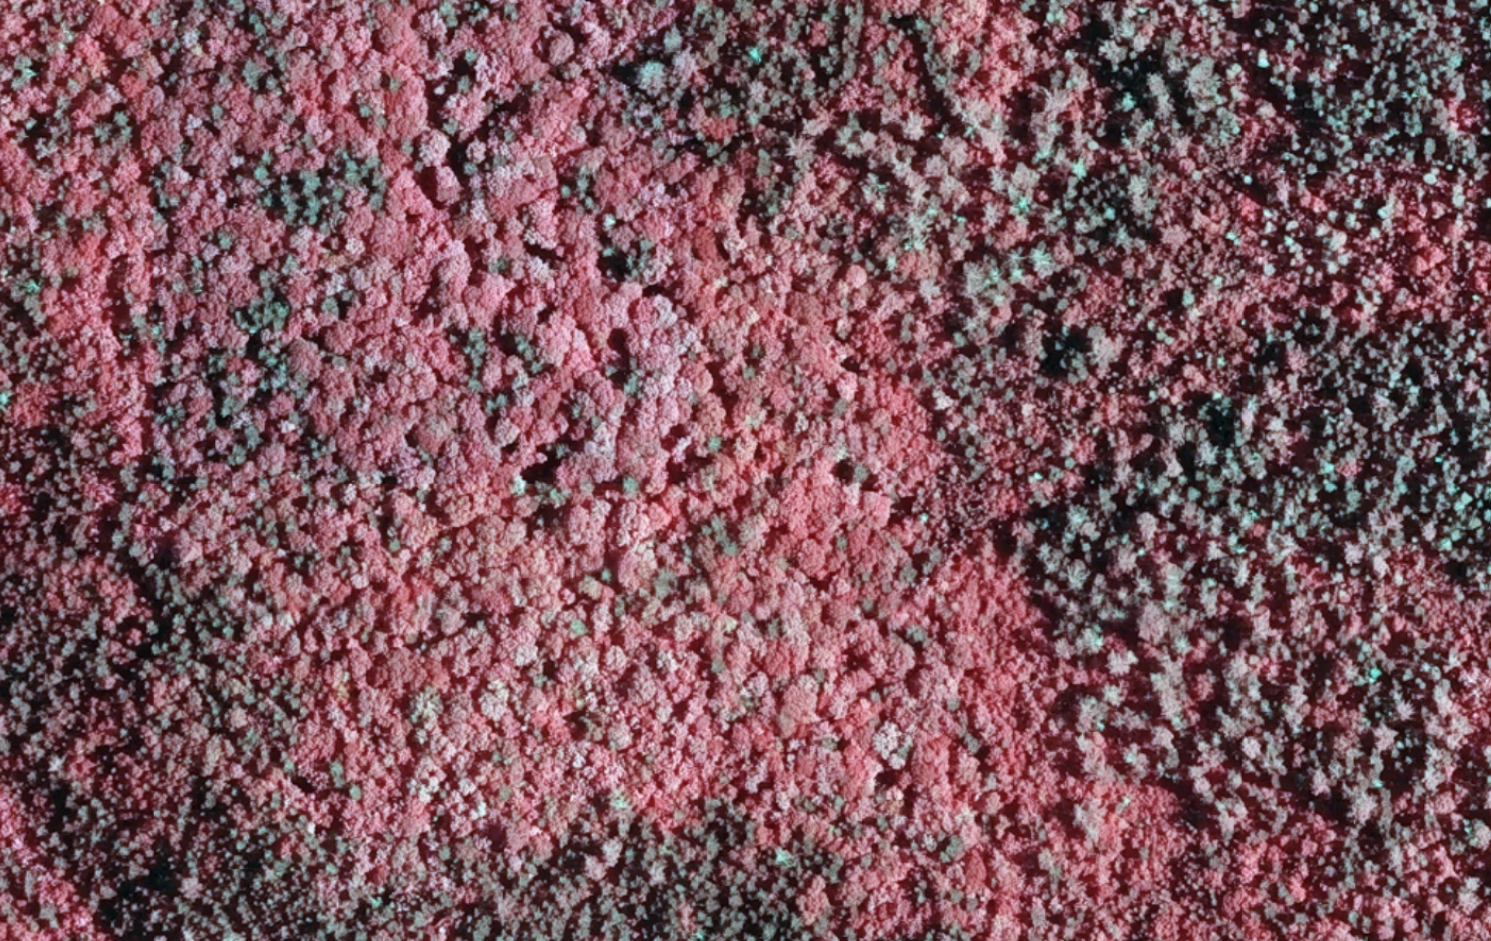
NAIP (National Agriculture Imagery Program) CIR imagery, available through your SilviCultural platform, captures both visible and near-infrared light. The imagery is displayed using a “false color” scheme where:
- Red tones = High infrared reflection (healthy, vigorous vegetation)
- Pink tones = Moderate infrared reflection (healthy vegetation)
- Cyan/blue tones = Low infrared reflection with visible light (stressed vegetation, exposed soil, water)
- Dark tones = Very low reflection (dense shadows, water bodies)
The brighter and redder the vegetation appears in CIR, the more infrared light it’s reflecting—and that means healthier, more photosynthetically active foliage with robust cellular structure.
Why CIR Matters for Forest Management
This difference in reflection gives you X-ray vision for your forest. Here’s what CIR imagery can reveal that visible imagery might miss:
Stand and Species Identification: This is where CIR imagery truly shines for forest management. Different tree species have distinctly different leaf structures, densities, and moisture content, which means they reflect infrared light at different intensities. In SilviCultural, you’ll notice that your oak stands appear a different shade of red than your pine stands, even when both are healthy. Hardwoods typically show brighter, more vibrant reds due to their broader leaves and higher moisture content, while conifers often appear in darker reds or burgundy tones because of their needle structure. This makes it much easier to delineate stand boundaries, map species composition across your property, and plan management activities for specific forest types—all without walking every acre.
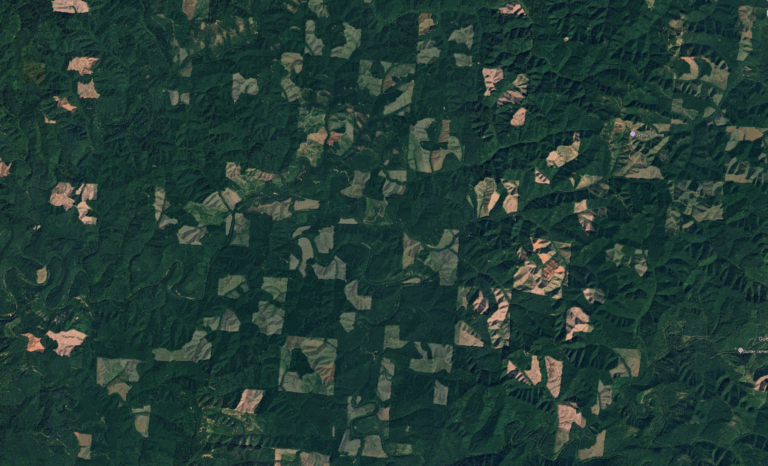
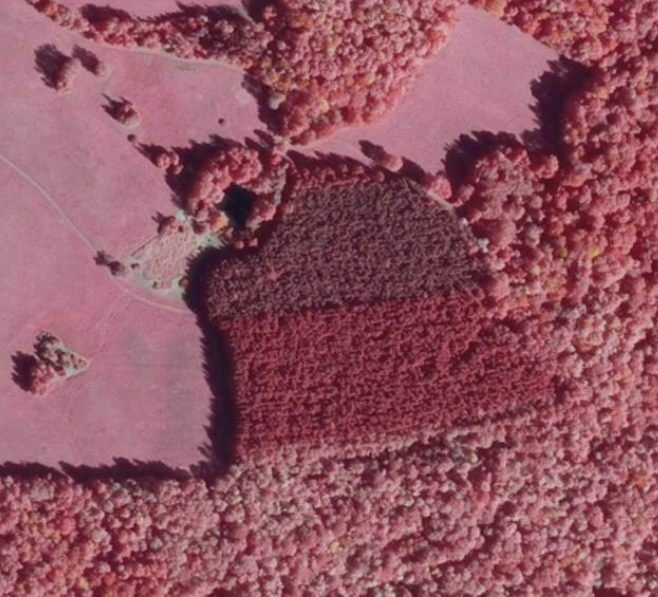
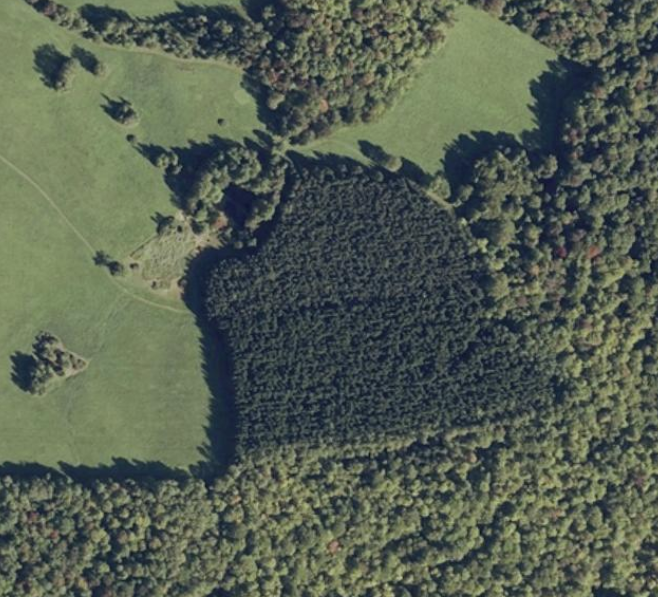
If you don’t believe me, check out the difference between RGB and CIR imagery for this softwood plantation containing two different species!
Canopy Density and Structure: Dense, multi-layered canopy reflects more infrared than sparse canopy because there’s simply more leaf surface area bouncing back that light. CIR imagery helps you identify variations in stand density, gaps in your canopy that might benefit from regeneration, or zones with excessive competition where thinning could improve overall stand health.
Spotting Stressors: While CIR isn’t a replacement for on-the-ground assessment, it can help you identify areas worth investigating. Trees stressed by disease, insects, drought, or competition will show reduced infrared reflection—appearing paler pink, dull, or even cyan compared to healthy surrounding vegetation. Water stress often shows up as reduced reflectance before leaves show visible wilting. Similarly, pest infestations or disease that affect leaf function may be visible in CIR before extensive browning occurs. These patterns help you prioritize where to focus your field time.
Differentiating Vegetation Types: CIR makes it easy to distinguish forest from other vegetation types. Your mature timber stands will show deep, rich reds, while understory shrubs might appear lighter pink, grassy openings show pale pink to white, and bare soil or roads appear in cyan or blue tones. This helps you quickly assess the composition and structure of your property.
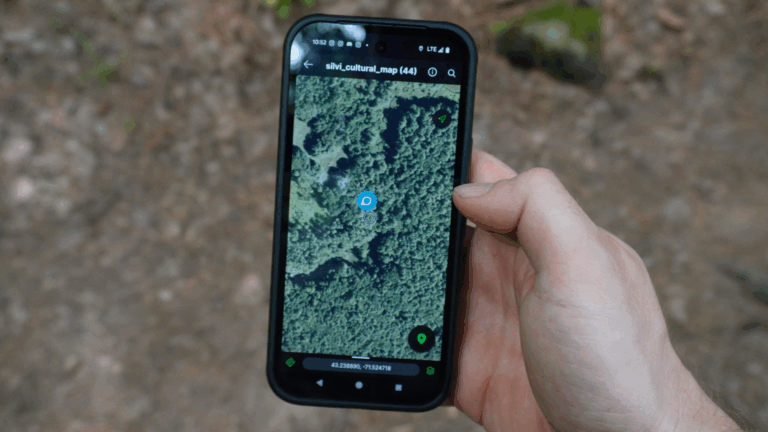
Using CIR in SilviCultural
When you pull up NAIP imagery in SilviCultural, you typically have the option to view either natural color (how things look to your eye) or CIR composites. Here are some practical ways to use CIR for forest management:
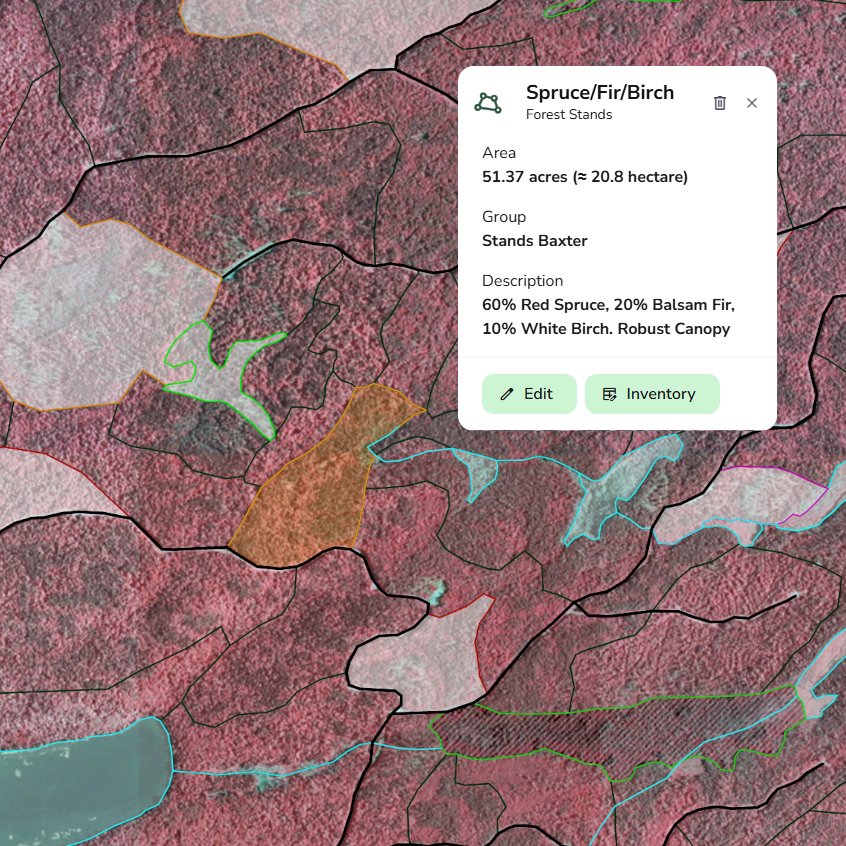
Stand Delineation and Mapping: Use CIR as your primary tool for identifying and mapping different forest types on your property. The variation in red tones makes it easy to draw stand boundaries—that patch of bright red oak is clearly distinct from the darker red pine adjacent to it, and both are obviously different from the regenerating clearcut showing pale pink. This makes inventory work much more efficient.
Planning Management Activities: When you’re deciding where to thin, which stands are ready for harvest, or where regeneration is needed, CIR gives you the overview you need. Dense, uniform red tones might indicate overstocked conditions, while variations in color within a stand can reveal pockets that need different treatment.
Identifying Problem Areas: Use CIR to guide your field work. When you notice unexpected pale areas, unusual patterns, or stands that don’t show the vibrant red you’d expect for their age and species, mark them for ground inspection. The imagery won’t tell you exactly what’s wrong, but it will tell you where to look.
Understanding Property Composition: Toggle between natural color and CIR imagery to build your understanding of what you own. You might discover stand boundaries you didn’t know existed, realize that what looked like uniform forest from the ground is actually several distinct species groups, or identify areas of regeneration success or failure.
The Bottom Line
Color Infrared imagery is like having a detailed map of your forest’s composition and structure that you can reference anytime from your desk. The vibrant red tones that make your woods look so unusual are actually showing you exactly what you want to see: healthy leaves efficiently converting sunlight into growth while staying cool by reflecting infrared radiation.
The next time you’re in SilviCultural reviewing your property, toggle between natural color and CIR imagery. You’ll immediately see stand boundaries and species patterns that would take days of field work to map on foot. That bright red stand in the north forty? It’s telling you it’s mature hardwoods in good health. That darker burgundy area adjacent? Probably conifers. That patch of pale pink? Worth a closer look on your next walk through the property.
By understanding what CIR imagery reveals, you’re not just looking at your forest—you’re seeing its structure, composition, and health patterns at a glance. And that’s exactly the kind of insight that helps you be a better steward of your land.