NEW: US Infrared and LiDAR Layers Now Available
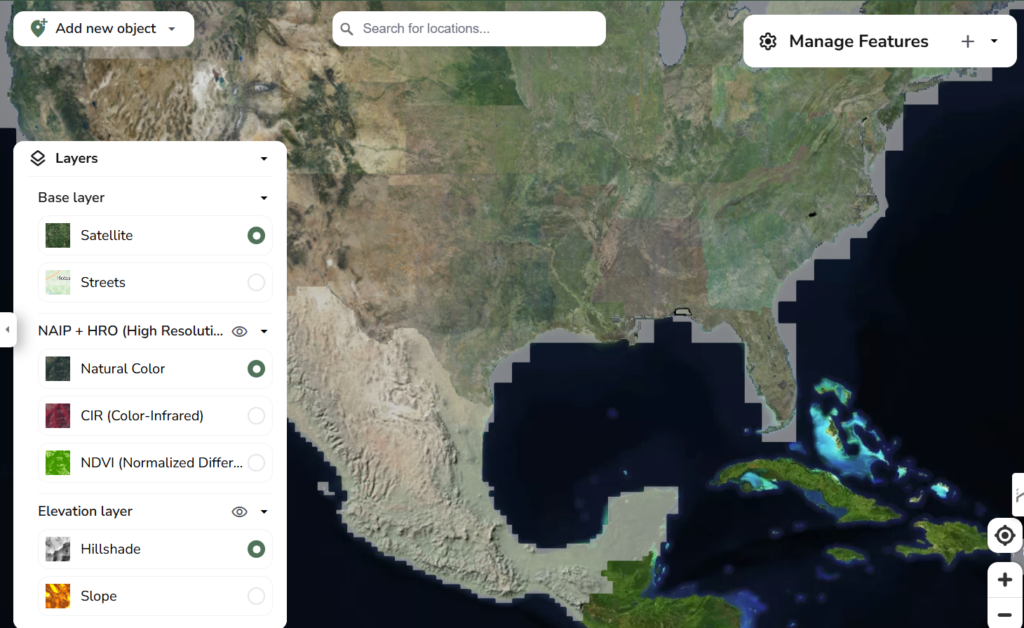
Forest management in today’s world requires precision, insight, and the ability to see beyond what’s visible to the naked eye. We’re excited to announce the addition of four powerful new data layers to our mapping application: Color Infrared (CIR) imagery, Normalized Difference Vegetation Index (NDVI), LiDAR hillshade, and LiDAR slope visualization, all available for the entirety of the United States
These advanced remote sensing tools transform how you understand, monitor, and manage forest ecosystems. Whether you’re assessing vegetation health, planning for wildfire mitigation, or making critical harvesting decisions, these new layers provide the detailed information you need to make informed choices.
Let’s explore how each of these technologies can revolutionize your forest management practices
Color Infrared (CIR) Imagery: Seeing Beyond the Visible Spectrum
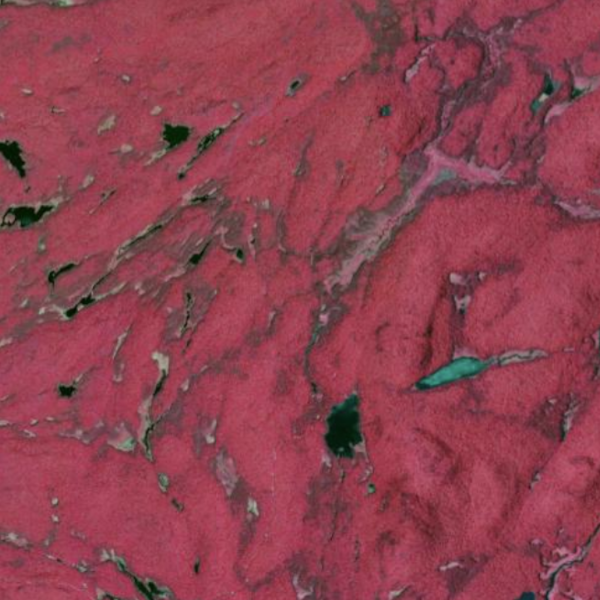
What is CIR Imagery?
Color Infrared (CIR) imagery represents an optimum method of visualizing forest landscapes. Unlike standard RGB photography that captures light in the visible spectrum, CIR captures near-infrared light that is invisible to the human eye but reflected off vegetation with higher intensity.
Benefits for Forest Managers
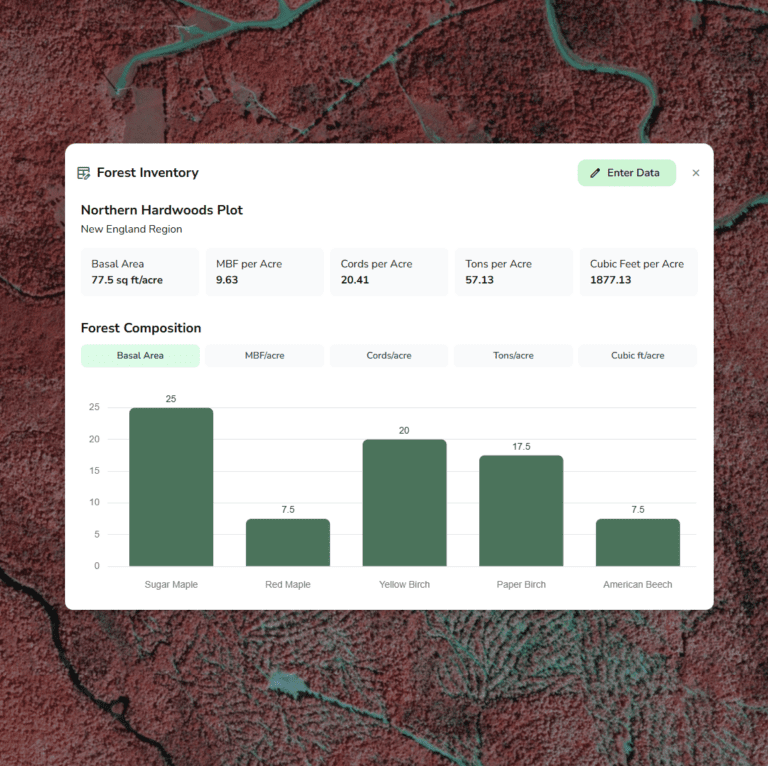
CIR imagery excels at highlighting vegetation patterns and health conditions that are otherwise difficult to detect. In these images, healthy vegetation appears as bright red or magenta, as plants strongly reflect near-infrared light during photosynthesis. This makes CIR particularly valuable for:
- Vegetation Health Assessment: Quickly identify stressed trees and vegetation before visual symptoms appear
- Species Differentiation: Distinguish between different forest types and tree species based on their unique infrared signatures
- Wetland Delineation: Accurately map riparian areas and wetlands within your forest management area
- Early Disease Detection: Spot potential insect infestations or disease outbreaks by identifying subtle changes in plant vigor
Practical Applications
Forest managers can use CIR imagery to prioritize management activities, directing resources to areas of greatest concern. By establishing baseline imagery and monitoring changes over time, CIR helps track the success of management interventions and identify emerging issues before they become visible problems.
When combined with ground-truthing, CIR imagery becomes an indispensable tool in your forest management arsenal, providing insights that go far beyond what traditional aerial photography can offer.
Normalized Difference Vegetation Index (NDVI): Quantifying Forest Health
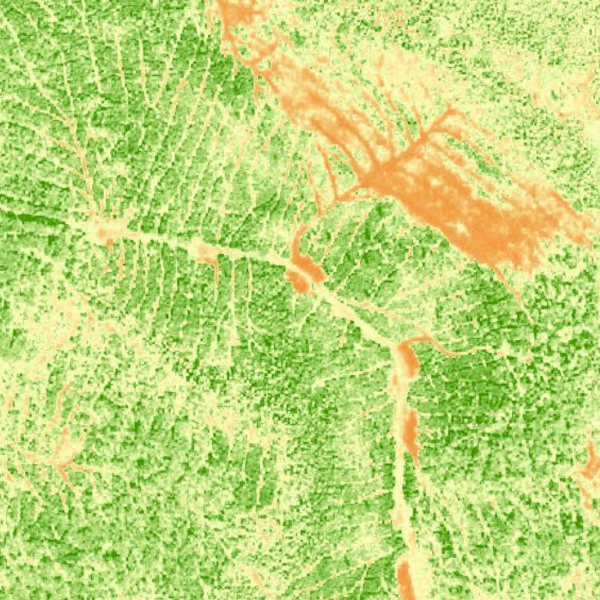
What is NDVI?
The Normalized Difference Vegetation Index (NDVI) transforms satellite imagery into a powerful analytical tool that precisely quantifies vegetation health and density. NDVI calculates the ratio between visible red light and near-infrared light reflected by vegetation, producing values ranging from -1 to +1. Higher positive values indicate healthier, denser vegetation, while values near zero or negative suggest bare soil, water, or non-vegetative surfaces. This imagery layer then converts those values into a color scale.
Benefits for Forest Managers
NDVI provides an objective, numerical assessment of forest conditions that can be tracked over time and compared across different areas:
- Objective Measurement: Convert subjective visual assessments into concrete numerical data displayed visually
- Early Stress Detection: Identify declining vegetation health before visible symptoms appear
- Biomass Estimation: Correlate NDVI appearances with ground-based measurements to estimate densities and biomass
- Regeneration Monitoring: Assess post-fire and post-harvest regeneration and the effectiveness of restoration efforts
Practical Applications
For forest managers, NDVI serves as an essential decision-support tool for prioritizing management activities. Areas with unexpectedly low NDVI values may warrant immediate investigation, while tracking NDVI changes following treatments helps validate management approaches.
LiDAR Hillshade: Revealing the Forest Floor
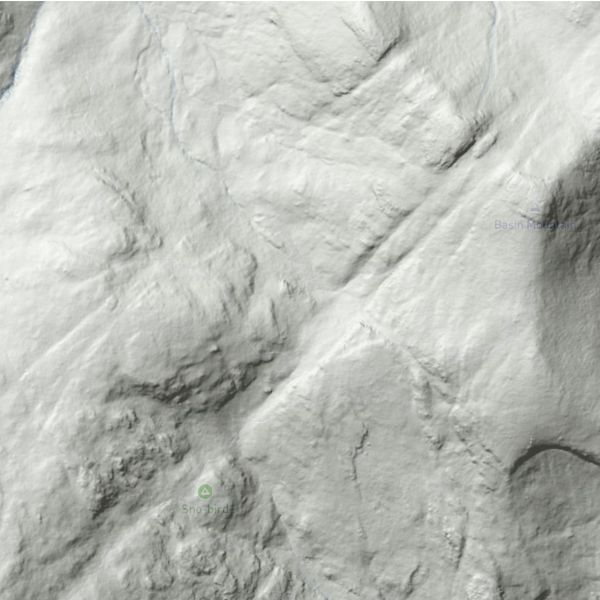
What is LiDAR Hillshade?
LiDAR (Light Detection and Ranging) hillshade represents a revolutionary advancement in terrain visualization, offering unprecedented insights into the topography beneath your forest canopy. This technology uses aircraft-mounted laser scanners to penetrate vegetation and precisely measure ground elevations. The hillshade layer simulates how sunlight would illuminate this bare-earth surface from a specified angle, creating a detailed three-dimensional representation of the terrain.
Benefits for Forest Managers
LiDAR hillshade provides critical information that traditional aerial imagery simply cannot capture:
- Canopy Penetration: See ground features that are normally obscured by dense forest cover
- Micro-topography: Identify subtle terrain variations including small streams, erosion channels, and depressions
- Infrastructure Planning: Optimally locate roads, landings, and equipment staging areas based on actual ground conditions
- Archaeological Preservation: Spot historical features like old roadbeds, building foundations, or cultural artifacts that require protection
- Hazard Identification: Detect unstable slopes, sinkholes, or other potential operational hazards
Practical Applications
Forest managers can leverage LiDAR hillshade to make more informed decisions about harvest planning, road construction, and erosion control. When planning timber harvests, this layer helps identify efficient extraction routes that minimize soil disturbance and stream crossings. For watershed management, the ability to see precise drainage patterns supports better culvert placement and riparian protection measures.
The hillshade layer also serves as an excellent base map for field navigation, providing context that topographic contours alone cannot convey. This improved spatial awareness enhances both operational efficiency and safety for anyone working in the forest.
By incorporating LiDAR hillshade into your mapping toolkit, you gain a clearer window into the physical structure of your management areas, allowing for more precise, terrain-aware planning and implementation.
LiDAR Slope Analysis: Precision Planning for Complex Terrain
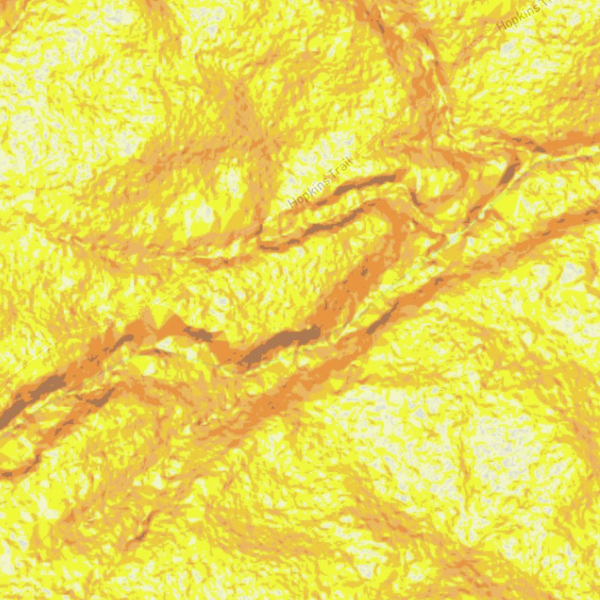
What is LiDAR Slope Analysis?
LiDAR slope analysis transforms raw elevation data into a powerful visualization tool that quantifies terrain steepness across your management area. This specialized layer calculates the rate of elevation change between adjacent pixels, expressing slope as a color ramp from pale yellow to dark orange.
Benefits for Forest Managers
Slope analysis provides critical insights for numerous aspects of forest management:
- Harvest Planning: Identify areas suitable for different logging systems based on operational slope limitations
- Erosion Risk Assessment: Pinpoint high-risk zones where soil disturbance should be minimized
- Equipment Accessibility: Determine where specialized equipment may be required or where conventional machinery cannot safely operate
- Regulatory Compliance: Quickly identify areas that exceed slope thresholds specified in forest practice regulations
- Wildfire Behavior Prediction: Better understand how slope will influence fire spread rates and intensity during planning or emergency response
Practical Applications
Forest managers can integrate slope analysis into their workflow to enhance both planning and implementation phases. During harvest planning, this layer helps delineate units appropriate for different machinery. For road construction, it identifies potential problem areas requiring specialized design or alternative routing.
The slope model also serves as a valuable communication tool when working with logging contractors, helping to set realistic expectations about operational challenges before equipment is mobilized. For watershed protection, combining slope data with soil type and precipitation patterns allows for targeted erosion control measures in the most vulnerable areas.
By incorporating LiDAR slope analysis into your decision-making process, you gain a clearer understanding of the physical constraints and opportunities within your management areas, supporting more efficient operations while minimizing environmental impacts.
Check Them Out Now!
We encourage you to explore these powerful new data layers in your next planning session. Each layer—Color Infrared, NDVI, LiDAR hillshade, and LiDAR slope—offers unique insights that can transform your management approach and decision-making process. Accessing these new tools is simple: just open your mapping application and navigate to the “Layers” tab. The more you experiment with these advanced visualization tools, the more value you’ll extract from your mapping system. We’re excited to hear how these new layers enhance your forest management practices!
(Not April Fools, I promise)

How often will maps be updated? Is there no way to know? I know its not your satellite to control… or is it? haha. I only ask as the NDVI would be more useful if it reflected the more current state of the vegetation. In my case, its showing the timber that was clear cut 5 or 6 years ago.
Officially they are updated every 2 years as part of NAIP. The last imagery was in late 2023, but they just released it a few weeks back, and I think all the tiles are still being updated on the image server, as some areas appear to be older. But yeah, I only have so much control over it, unfortunately. This update essentially just connects the mapping app to an external server that holds the imagery.
The NDVI data set is new to me, so Im still trying to figure out how to use it effectively. It does have some advantages–I can see an impact on the infrared reflectivity on harvests on my land, for example, but to really use it to its fullest potential, I think I’d eventually like to build in the ability to compare it with historical imagery, so you can see changes over time.
I was thinking the same thing, “I think this is valuable data but I’m not exactly sure how to interpret it”
Historical data would be a key feature. Thanks for including the ground slope lidar as this is the most relevant for my consulting work with farmers. Agricultural and forestry land go hand in hand.
Greetings,
Has anybody used the lidar features? I am very interested in using this as a tool for consulting. Does this yield low of high definition lidar? Is this lidar throughout the US, or is it somewhat spotty. Are there holes in the lidar data? Is it consistent and reproducible?
Thanks,
@redhawk IUt includes all USGS/FEMA flights, which is basically the entirety of the US at this point, minus some small areas of mountainous public land out west.
You can see the coverage here: https://apps.nationalmap.gov/lidar-explorer/#/